Monitor your integration runtimes remotely with webMethods.io Integration
Discover, Share, and Collaborate with the Software AG Tech Community
The Software AG Tech Community is your single best source for expert insights, getting the latest product updates, demos, trial downloads, documentation, code samples, videos and topical articles.
But even more important, this community is tailored to meet your needs to improve productivity, accelerate development, solve problems, and achieve your goals.
Join our dynamic group of users who rely on Software AG solutions every day, follow the link or you can even sign up and get access to Software AG's Developer Community.
Thanks for stopping by, we hope to meet you soon.
products: webMethods.io Integration
Introduction
Gain the governance and agility you need to enhance system reliability and performance with the webMethods.io control plane. Learn how to manage your integration runtimes remotely using webMethods.io observability features.
This is the second part of a series of webMethods.io Integration tutorials exploring the platform’s Super iPaaS Develop anywhere, deploy anywhere capabilities. If you missed the previous part, you can find it here: Edge Runtime Management with webMethods.io Integration.
Prefer watching a video? See our Developer Evangelist Theo Ezell walk through the steps in this video tutorial:
Monitor Integration Runtimes Remotely with webMethods.io | Demo
Pre-requisite
A webMethods.io Integration environment.
Note: These capabilities are not available by default. Contact your sales representative for more information.
Default Cloud Runtime
Log in to your webMethods.io Integration environment and navigate to the Integration Runtimes tab.
First, we’ll go through the default Cloud Runtime performance.
Overview
To open its overview dashboard, click on it:


Please note that the Cloud Runtime is part of the tenant and it cannot be stopped or restarted.
The Overview tab shows details about the runtime, like how long the server has been up, and current Disk space, Memory, and CPU utilization.
What is more, if you click on the Diagnostics button, you can download a file with diagnostics information about the runtime:

The time frame selection you see on the right
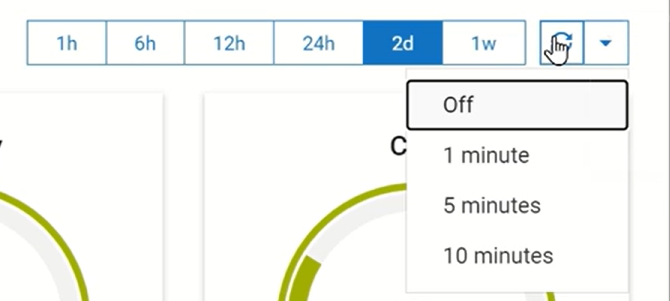
affects the time series graphs at the bottom of the page:

Use the refresh button next to the time frame to refresh the data manually or to set a refresh interval.
Projects
The projects tab contains all the projects deployed to the current runtime. In the case of the Default Runtime, these are all projects on the tenant.

You can use the search to narrow the view. Open a project just by clicking on it.
Logs

Like the Overview tab, the Logs dashboard can be customized. You can change its view:

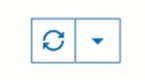
set refresh interval or manually refresh the data:
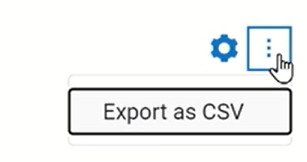
and even export the log data as a CSV and use it for offline analysis.
What is more, the log type dropdown allows you to choose between the Server log, Error log or Service log:
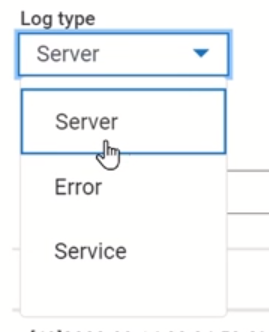
While the Server log only shows the current log, the Error and Service logs allow you to specify the time frame as well.
Services

At the top of the Services tab, you can see two graphs showing the top 5 slow services by response time and the top 5 services by request count. Using the time frame selection, you can see the services changes over time.
At this tab, you will also find the Reset server cache button.
The table below lists all the services that have run since the last time the server started.

Here you can also find information about the number of currently running services, how many of them succeeded or failed, and the timestamp of the last run. Additionally, you can see the minimum, average, and maximum response times.
The last column will indicate if there were any cache- and/or prefetch-enabled services, or if a service is configured with a circuit breaker. For detailed information about these services, you can look through the “Cache and prefetch information” and the “Circuit breaker information” tabs.
Connections

Lastly, the Connections tab displays the built-in database connections along with any adapter connections.
You can perform several actions on the internal database connections such as test, restart, edit, or remove.
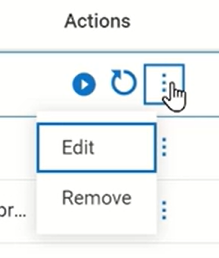
But be careful using these functionalities, especially on the default runtime.
Similarly, adapter connections can also be disabled and enabled, edited, or restarted.
Edge Runtime
Managing a remote Edge Runtime is identical to managing the Default Cloud Runtime. If you go back to the Integration Runtimes tab and open an Edge Runtime, you can see that all the same functions are available.
However, in the Projects tab, you can notice that only projects deployed to the Edge Runtime are there.
What’s next
Continue exploring the platform’s Developer anywhere, deploy anywhere capabilities and learn how quickly you can register a new webMethods.io Integration runtime:


