Monitor the execution of workflows and flow services with webMethods.io Integration
Discover, Share, and Collaborate with the Software AG Tech Community
The Software AG Tech Community is your single best source for expert insights, getting the latest product updates, demos, trial downloads, documentation, code samples, videos and topical articles.
But even more important, this community is tailored to meet your needs to improve productivity, accelerate development, solve problems, and achieve your goals.
Join our dynamic group of users who rely on Software AG solutions every day, follow the link or you can even sign up and get access to Software AG's Developer Community.
Thanks for stopping by, we hope to meet you soon.
products: webMethods.io Integration
Introduction
Properly managing webMethods.io workflows and flow services helps you gain control over your business processes and services for better performance and scalability.
In this tutorial, learn how to use webMethods.io monitoring capabilities to track the execution of your workflows and flow services across execution planes, all in one place.
This is the last part of a series of webMethods.io Integration tutorials exploring the platform’s Super iPaaS Develop anywhere, deploy anywhere capabilities. If you missed the previous part, you can find it here: Export and import Flow services with webMethods.io Integration.
Prefer watching a video? See our Developer Evangelist Theo Ezell walk through the steps in this video tutorial:
Monitor the execution of workflows and flow services with webMethods.io Integration
Pre-requisite
A webMethods.io Integration environment.
Note: These capabilities are not available by default. Contact your sales representative for more information.
Let’s get started
Log in to your webMethods.io Integration environment and navigate to the Monitor tab. Here, you can monitor the execution across all Runtimes in a single place.
Monitor dashboard
From the Monitor dashboard, you can view the statistics for either the Default Cloud Runtime or the various Edge Runtimes. Using the Execution plane dropdown, you can navigate through the Runtimes:

As you can see, the executions on the Default Cloud Runtime include both workflows and Flow Cloud services. You can even select different timeframes and go back 4 weeks.
However, the Edge Runtime dashboard summarizes only the Flow Anywhere services that run on that Runtime. What is more, note that the Edge Runtime data is limited to the past week:

Workflow execution dashboard
Moving on to the workflow execution dashboard, you can see all workflows executed during the selected timeframe:

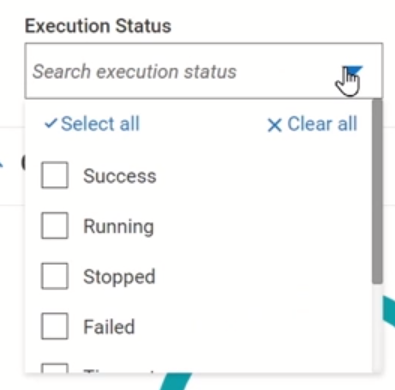
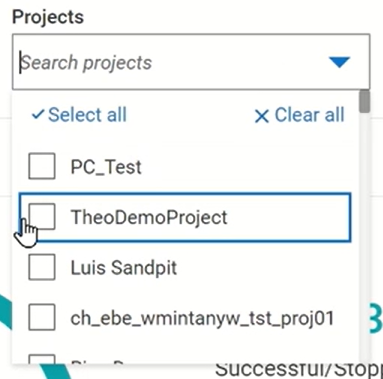
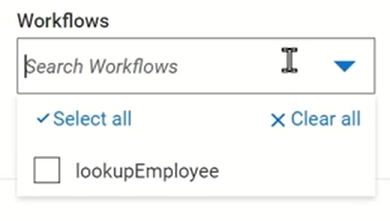
Expanding the Filters section, you can filter the workflows by
Execution Status
Projects
Workflows
Scrolling down the page, you will find the Executions table. Use the gear icon to customize the columns you want to view:

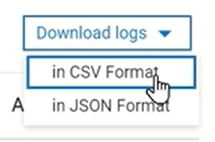
What is more, you can also download the logs in CSV or JSON format:
Clicking on the workflow name from the table takes you to a detailed view of that execution:

You can go through each step and observe the inputs and outputs.
Flow service execution dashboard
Here, you can monitor the execution of all Flow services:

Expanding the Filters section gives you again the opportunity to apply different filters. But notice that while you are on the Default execution plane, you can filter the Flow services by Execution Sources, Execution Status, Projects, individual Flow services, or Context id:

However, if you select a remote Edge Runtime, the options diminish severely, and the Flow services can be filtered only by Execution status:

What is more, by scrolling down the page to the Executions table, while on the Default Runtime, you can customize the table with the following columns and download the logs as a CSV file:

Meanwhile, on a remote Edge Runtime, the available columns are only Name, Start and Duration time, and Status and there is no download option:

Now you’ve seen how to use the webMethods.io Integration monitor function to track the execution of your workflows and Flow services all in one place.
Useful links | Relevant resources
Continue exploring the platform’s Developer anywhere, deploy anywhere capabilities with the previous parts of this series of webMethods.io Integration tutorials:
Export and import Flow services with webMethods.io Integration
Use workflows to orchestrate flow services across runtimes with webMethods.io Integration.
Create and develop flow services to run on the Cloud Runtime with webMethods.io Integration
Monitor your integration runtimes remotely with webMethods.io Integration.
Monitor the execution of workflows and flow services with webMethods.io Integration


