
Introduction
Grafana is an open-source analytics and interactive visualization web application. It provides charts, graphs, and alerts for the web when connected to supported data sources. It allows you to query, visualize, alert on, and explore your metrics, logs and traces no matter where they are stored. It provides you with tools to turn your time-series database (TSDB) data into insightful graphs and visualizations.

As a visualization tool, Grafana is a popular component in monitoring stacks, often used in combination with time series databases such as InfluxDB, Prometheus, and Graphite; monitoring platforms such as Sensu, Icinga, Checkmk, Zabbix, Netdata, and PRTG; SIEMs such as ElasticSearch and Splunk; and other data sources. The Grafana user interface was originally based on version 3 of Kibana.
Grafana comes in multiple flavors:
Grafana OSS, is the open source version of Grafana.
Grafana Enterprise is the commercial edition of Grafana that includes additional features not found in the open-source version, Grafana Enterprise adds enterprise data sources, advanced authentication options, more permission controls, 24x7x365 support, and training from the core Grafana team.
Grafana Cloud, is a highly available, fast, fully managed OpenSaaS logging and metrics platform. It has all Grafana features, but it is hosted on the cloud.
Besides the wide range of visualizations and data sources that are available immediately after you install Grafana, you can extend your Grafana experience with plugins.
You can install one of the plugins built by the Grafana community or build one yourself.
Grafana supports three types of plugins:
Panel Plugins: is used to add new visualizations to Grafana dashboard.
Data Source Plugins: is used to add support for new databases or data sources.
Apps Plugins: is used to bundle data sources and panels to provide a cohesive experience.
The scope of this article is to illustrate how you can build a Grafana Dashboard using community Grafana Data Source Plugins to read data from Cumulocity IoT using Cumulocity IoT Rest APIs and Notification API 2.0.
Please note that this document is for achieving POC setups and might need improvement for production use cases.
Prerequisites
This Integration guide is based on the following prerequisites:
Cumulocity IoT Release 10.15.
Grafana Open Source 9.4.7 installed on windows machine.
Infinity Data Source plugin 1.4.
Customized WebSocket plugin (based on WebSocket API Plugin from Golioth version 1.1).
Grafana Integration using Cumulocity IoT Rest APIs
Grafana comes with Data Source plugin called “Infinity”, which visualizes data from JSON, CSV, XML, GraphQL and HTML\Rest endpoints in Grafana.
In the scope of this article, we will create a panel to show Battery measurements produced by Devices boarded on Cumulocity IoT.
Steps to configure Infinity data source & panel
Install the Infinity plugin in Grafana if it is not installed.
Create a new data source for the infinity plugin.
a. Set the data source name to “Cumulocity Rest”.
b. In the Authentication tab, choose Basic Authentication and enter your Cumulocity credentials
/username & Password. And set Allowed hosts to your tenant URL.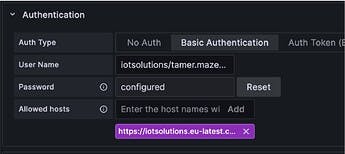
c. In the Headers tab add the following headers:
Key to Accept & Value to\*/*
d. Click the save & test button.From the Dashboards menu, create a new Dashboard called ‘Cumulocity dashboard’.
Add a new Panel to the created Dashboard, then select Edit from the pop-up menu.
In the right pane do the following:
a. Choose ‘Time series’ as the panel type.
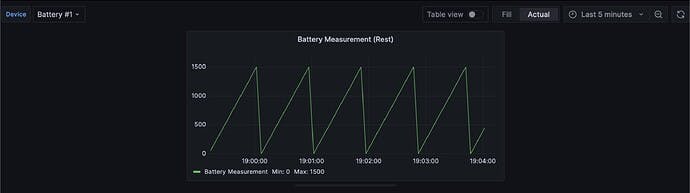
b. Set the title to ‘Battery Measurement (Rest)’.
c. Select Legend Visibility.
d. Set Legend values to Min & Max.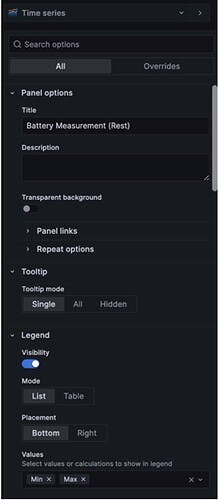
In the left bottom pane do the following:
a. Choose the ‘Cumulocity Rest’ data source from data source dropdown.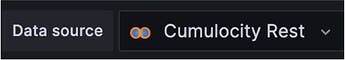
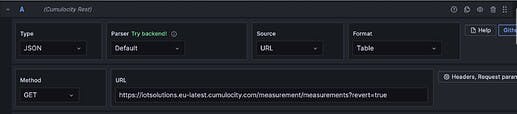
b. In the Query section, set:
Type to JSON.
Parser to Default.
Source to URL.
Format to Table.
Method to Get.
URL to Measurements Rest API on your tenant. (ex: https://tennat-url/measurement/measurements?revert=true)
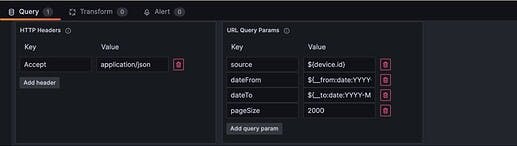
Click ‘Headers, Request params’ button, to set request headers and query params as follows:
a. Add header key Accept and value application/json.
b. Set the following in the Query Params section:source to ${device.id}, where device is a dashboard variable created in Configure Grafana Dashboard Variable below.
dateFrom to ${__from:date:YYYY-MM-DDTHH:mm:ss+02:00} , ‘__from’ is an internal variable in the dashboard, and it holds the from date.
dateTo to ${__to:date:YYYY-MM-DDTHH:mm:ss+02:00}, ‘__to’ is an internal variable in the dashboard, and it holds the to date.
Set pageSize to 2000.


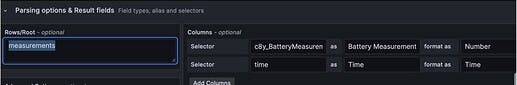
c. Set the following in the ‘Parsing options & Result fields’ section:
Rows\Root to measurements.
Columns as follows:
Selector to c8y_BatteryMeasurement.B.value, Title to Battery Measurement, format as to Number.
Click Add column.
Selector to time, Title to Time, format as to Time.

In the upper left pane, you can test your configuration, by selecting the right device from the device dropdown, and the right time frame from the data selector.
Click Save\Apply to save and apply the changes.

Web Socket Integration
Grafana comes with a Web Socket data source plugin called “WebSocket API By Golioth”, which allows you to connect a WebSocket endpoint as a Data Source for your Grafana dashboard. However, it supports only JSON payload.
As Payload of Cumulocity IoT Notifications 2.0 APIs, the response is not in a well-formed JSON structure, we had to customize the Web Socket Plugin to accept such payload.
In the scope of this article, we will illustrate the implemented customization in the Grafana Web Socket Plugin, which will allow it to accept payload from Cumulocity IoT Notifications API, then we will create a data source to connect with Cumulocity IoT Notification APIs using web socket, and a panel to show Battery measurement produced by a Device onboarded on Cumulocity IoT.
Steps to Add Custom Web Socket data source plugin to Grafana
Download websocket plugin source code from the following GitHub URL GitHub - golioth/grafana-websocket-plugin.
In the Grafana installation folder, open ‘defaults.ini’ file, which holds Grafana default configurations.
Go to “[paths]” section, and lookup for the following key ‘plugins’, where you will find the default path for installed plugins.
Grafana runs in two modes (Development and Production), and in the production mode it will support only signed plugins, so to add your own unsigned plugins to Grafana you have to do the following in ‘defaults.ini’ file:
a. Set app_mode to development.
b. In [plugins] section, add your plugin name to the list
allow_loading_unsigned_plugins = golioth-websocket-datasource.Unzip the archive, which you have downloaded from Github, and copy it to the plugins folder, which is mentioned in step 3.
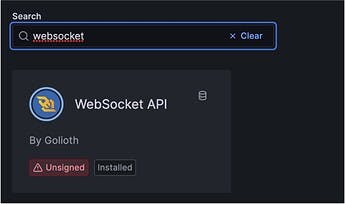
Restart Grafana service, and you should find the newly added plugin in the list, as you see in the below image, the plugin is installed and marked as unsigned.

Steps to customize and build WebSocket data source plugin**
Use IDE of your choice to edit and build the custom plugin, I have used Visual Studio Code.
Please check the following URL, which shows how you can build a custom Grafana plugin
Build a data source backend plugin | Grafana Labs.Please make sure the following are installed on your development machine:
Go
Mage
NodeJS
Yarn
Go to websocket plugin folder, where you have copied the source code, and run the following commands:
a. Install frontend dependencies and build frontend parts of the plugin to dist directory:yarn installyarn build
b. Run the following to update the Grafana plugin SDK for Go dependency to the latest minor version:go get -u github.com/grafana/grafana-plugin-sdk-gogo mod tidy
c. Build backend plugin binaries for Linux, Windows and Darwin to dist directory:mage -v
In IDE, open the following file “/pkg/plugin/ws_data_proxy.go”, then update “proxyMessage” function as follows:
 func (wsdp *wsDataProxy) proxyMessage() {
     frame := data.NewFrame("response")
     m := make(map[string]interface{})
     log.DefaultLogger.Info("Ws Connect", "inside proxyMessage", "")
     for {
         message, ok := <-wsdp.msgRead

         if !ok {
             return
         }

         json.Unmarshal(message, &m)

         var message_str = string(message)
         var json_start_idx = strings.Index(message_str, "{")
         message_str = message_str[json_start_idx:]

         log.DefaultLogger.Info("Ws Connect", "after slicing", message_str)

         frame.Fields = append(frame.Fields, data.NewField("data", nil, []string{message_str}))

         err := wsdp.sender.SendFrame(frame, data.IncludeAll)
         if err != nil {
             log.DefaultLogger.Error("Failed to send frame", "error", err)
         }
         frame.Fields = make([]*data.Field, 0)
     }
 }
Run the following command to rebuild the plugin:
mage -vRestart Grafana Service.
Steps to configure Custom WebSocket data source & panel**
Create a new data source for a custom WebSocket plugin.
a. Set data source name to “Cumulocity custom WebSocket”.
b. In the Web Socket section set Host to Cumulocity IoT Notifications API Endpoint “wss:///notification2/consumer/”. You have to enable Notifications API in your tenant if it is not enabled.
c. In the Query Parameter section, Add a new key:
Set Key to token and value to Notification API subscription token
Note: Grafana Web Socket Plugin assumes that you already have subscribed to a certain Notification API channel, and you already have created the required token.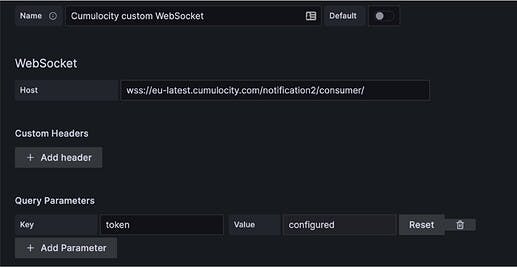
d. Click Save & Test button.
Add a new Panel to the created Dashboard, then select Edit from pop-up menu.
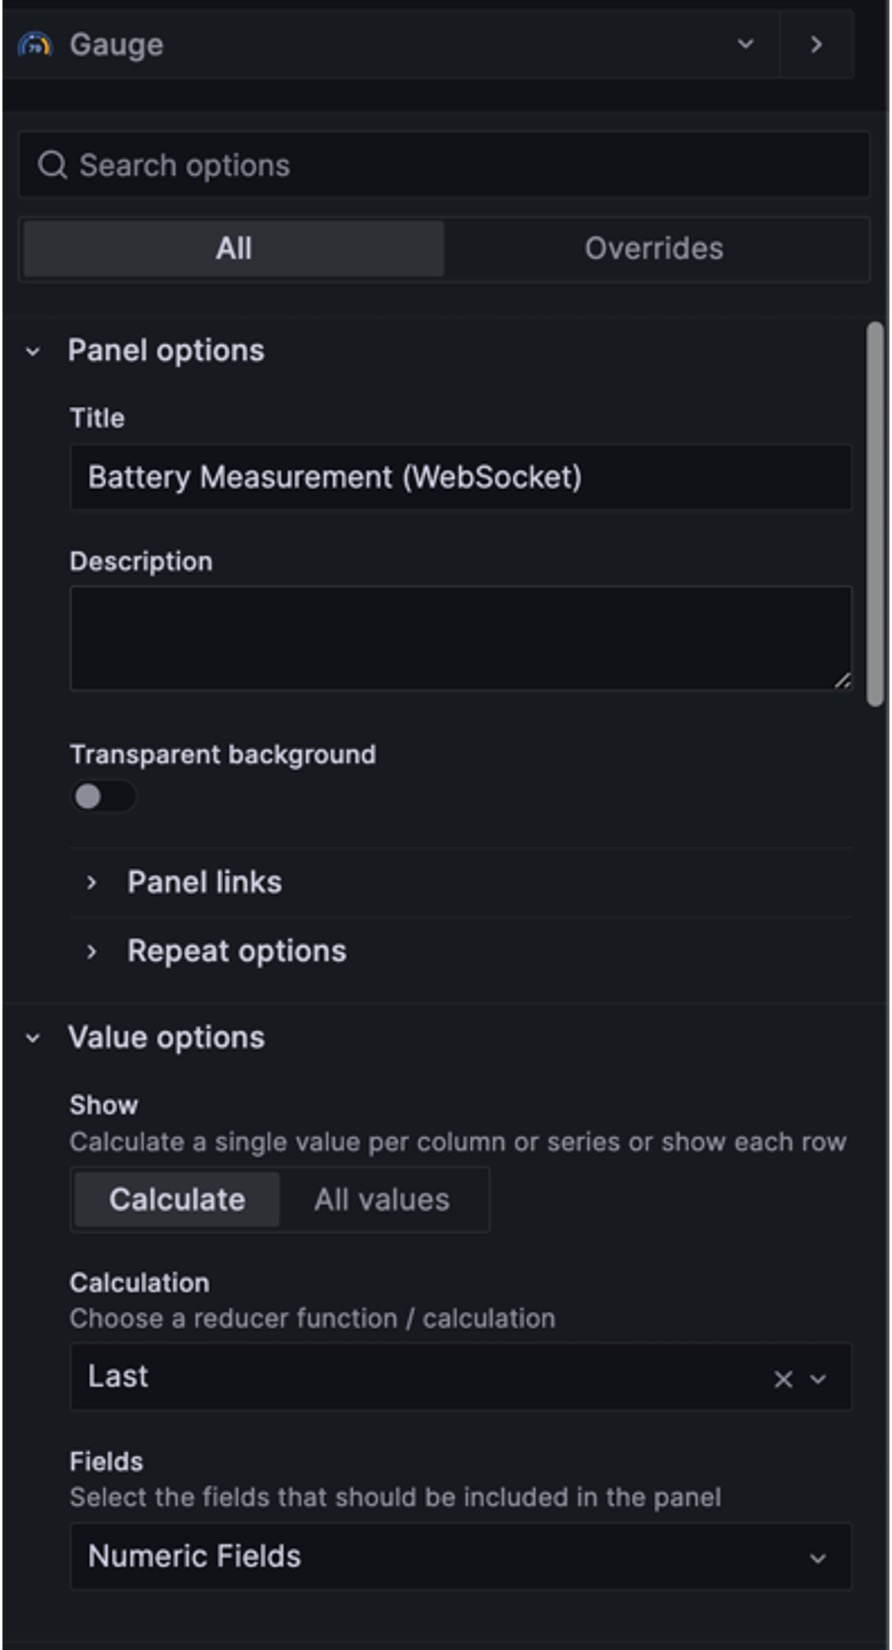
In the right pane do the following:
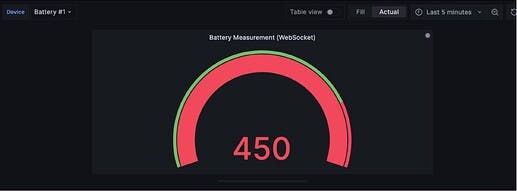
a. Choose ‘Gauge’ as the panel type.
b. Set the title to ‘Battery Measurement (WebSocket)’.
c. Select ‘Calculate’ under Show in the Value Options tab.
d. Set Calculation to ‘Last’.
e. Set Fields to Numeric Fields.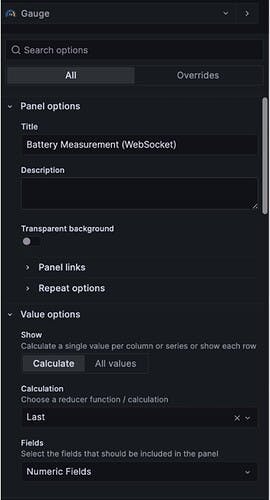
In the left bottom pane do the following:
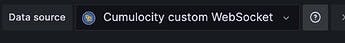
a. Choose ‘Cumulocity custom WebSocket’ data source from the data source dropdown.
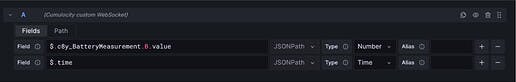
b. In the Query section:
Select Path tab
Set Path to ‘measurements/${device.id}’, where the device is a dashboard variable created in Configure Grafana Dashboard Variable below.
Set fields as follows:
In the upper right pane, you can test your configuration, by selecting the right device from the device dropdown.
Click Save\Apply to save and apply the changes.


Configure Grafana Dashboard Variable
By using Grafana dashboard variables, you can build a dynamic panel, which takes inputs from a user, through dashboard variables. In our case, we will create a dashboard variable called ‘device’, which allows the user to select a device from a list of all devices in a specific tenant, and according to the selected device, the dashboard’s panels will be refreshed to show the corresponding data for this device.
As part of this document scope, we will add a new variable called “device”, which will be used as an input for dashboard’s panels.
Create a new dashboard.
From dashboard settings, select the variables menu item from the side menu.
Click New variable.
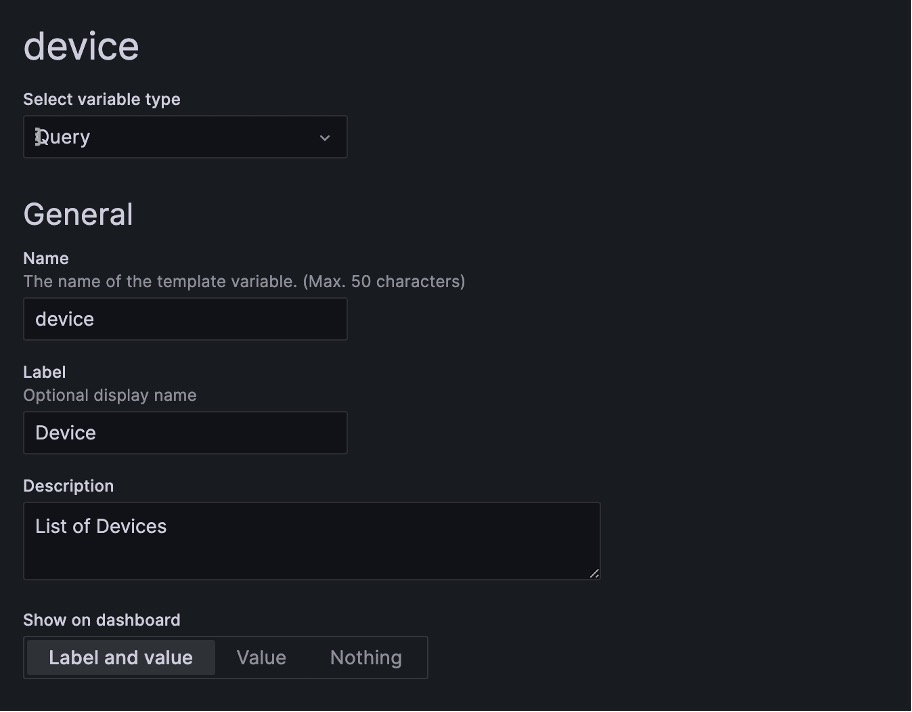
Add the following information, Set:
a. Variable type to Query.
b. Name to device.
b. Label to Device .
d. Show on the dashboard to Label & Value.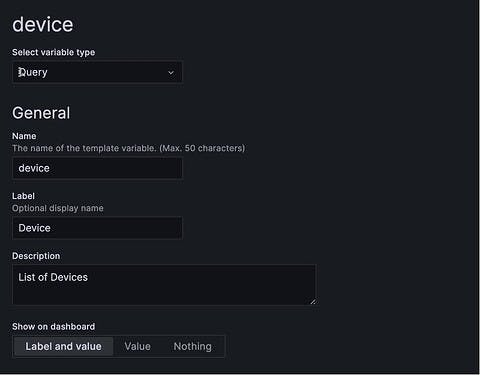
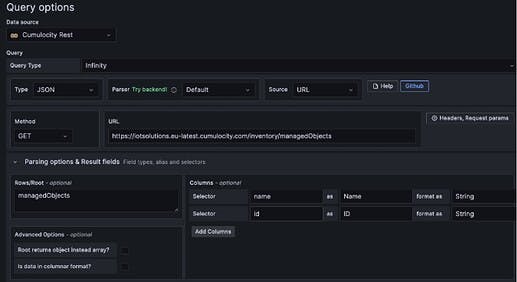
e. Data source to Cumulocity Rest data source.
f. Query Type to Infinity.
g. Type to JSON.
h. Source to URL.
i. Method to Get.
j. URL to https:///inventory/managedObjects?pageSize=2000.
k. In Parsing Options & Result fields:Row/Roots to managedObjects.
Columns as follows

l. You can set, how you would like to sort data in the variable, ex: Alphabetical (desc)
m. Click Apply
n. Device Dropdown box will appear above the list of panels.

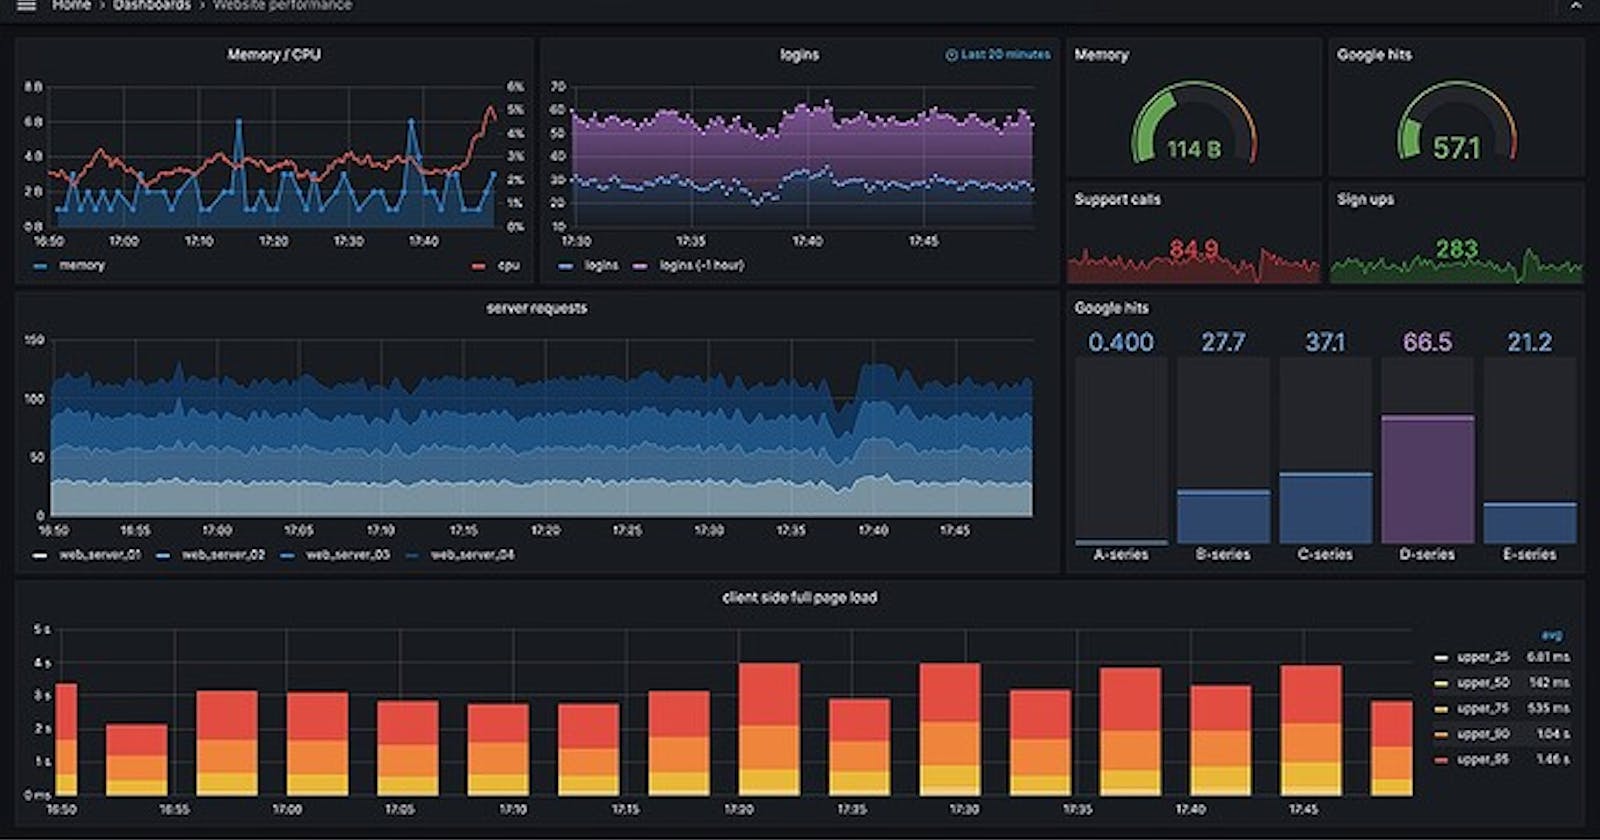
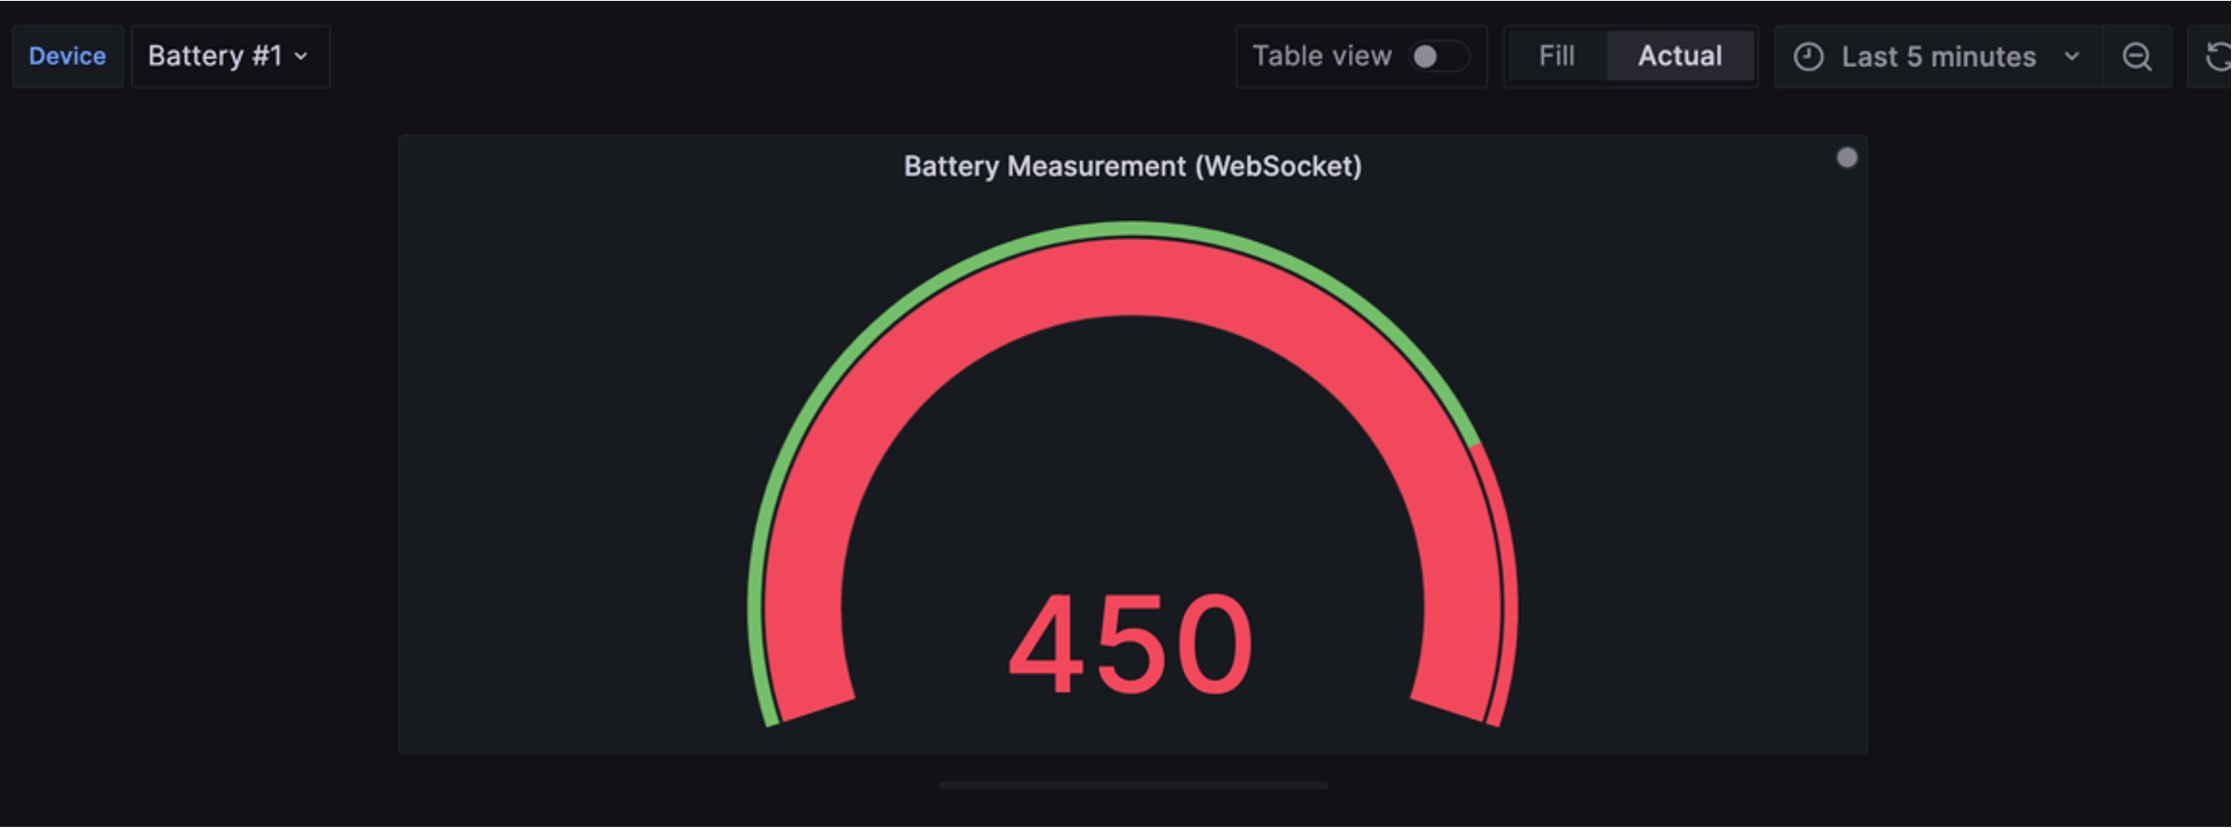
The Final Dashboard
Here is the final dashboard
Next Steps
Custom Web socket plugin needs the following enhancements:
Currently, the plugin cannot reestablish the connection with Cumulocity IoT when the connection is interrupted by any network problem. We need more technical investigation to understand how the used GoLang Web Socket library is handling WebSocket connection time out and set the proper value for it.
The Plugin accepts a subscription token as one of its inputs, however for better management of connection with Cumulocity IoT Notification APIs, it is better that the plugin itself creates a subscription and token, when plugin establishes connection with Cumulocity IoT, and delete subscription when the connection is closed.
Signing a plugin allows Grafana to verify the authenticity of the plugin with signature verification. This gives users a way to make sure plugins haven’t been tampered with. The Custom Web Socket API plugin needs to be signed before sharing it with customers. For more information about the Signing Grafana plugin, please check the following URL Sign a plugin | Grafana documentation
Grafana can run as a docker container, more technical investigation is required to run Grafana inside Cumulocity as an application.