Overview
In the other article about basic Microservice Monitoring we demonstrated an easy and low effort way to monitor microservices within a cumulocity tenant. While this is sufficient for small and limited use cases in more advanced use cases, where you have multiple microservices deployed in different tenants, you need a more advanced monitoring solution.
In this series of articles of Advanced Cumulocity IoT Microservice Monitoring I will guide you to …
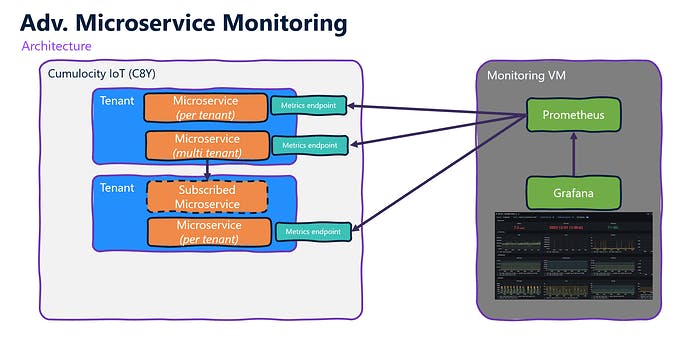
In this part 1 I will also describe the basic architecture and components. So let’s get started!
Components
First let’s talk about 3rd Party components we use and which are recommended.
In several IoT projects we have used the following components. They are also used internally to monitor product microservices:
Prometheus - is an open source tool to collect & store metrics data. As microservices generate a lot of metrics which we need to collect & store like CPU/Memory/Disk utilization prometheus comes at hands to easily collect that metrics.
Grafana - is an open source tool to create operational dashboards. Based in data stored in prometheus you can easily create your operations dashboards for your microservices. As it is perfectly integrated to prometheus you quickly get a visualitation layer on top of metrics data stored in prometheus.
Log aggregation could be added here as well but is quite a complex topic which we will describe in another article. As a quick win you can have a look into Promtail and Loki but there are also other log aggregation systems available with a different set of supported features.
Each microservice has to provide an prometheus ready metrics endpoint. Prometheus will regularly poll all metrics endpoints of all microservices of different tenants to retrieve & store the metrics. Grafana accesses the metrics data in prometheus and will visualize the data in Monitoring Dashboards. Via browser a user can login to grafana. Thresholds and alerts can be configured directly in prometheus alert-manager.
As you might have recognized all of the suggested tools are open source tools which are focused on application monitoring.
Please note: A microservice must specify an isolation level. Two potential options are available:
per tenant - Each microservice will have his own instance in each tenant. Each microservice in each tenant must be monitored.
multi tenant - A microservice has only one instance but have access to other tenant. In this case it is only necessary to monitor one microservice which is subscribed to multiple tenant
Check the documentation for more details
Pro & Cons adv. microservice monitoring
Let’s have a view in Pros & Cons of this advanced setup of microservice monitoring also in comparison to the basic microservice monitoring.
Pros
Supports microservices with both isolation levels (per tenant & multitenant)
Supports microservices subscribed to multiple tenants
No additional license fees for software (open source software only)
No impact on operational costs of Cumulocity tenant
Allows dynamic monitoring & visualization
Independent from Cumulocity IoT infrastructure
Cons
Additional infrastructure needed to host monitoring tools
More complex setup of 3rd party component
Additional maintenance effort of monitoring tools
As a conclusion you should use this advanced monitoring when …
you have to monitor multiple microservices in your IoT Solution
you have to monitor microservices with per_tenant isolation in specific tenants
your microservices are critical for your IoT solution
you want to collect monitoring metrics externally & independently
you want to have the monitoring & operation separated from the IoT solution
you are able to operate & maintain 3rd party monitoring tools
you have additional infrastructure (VM) available to do so.
If you have only a small number of microservices to monitor you might dig deeper on the first guide which describes how to set up a basic microservice monitoring.
Microservice Preparation
If we want to monitor microservices we need at least one microservice deployed in our Cumulocity IoT Tenant. which provides metrics we can use.
As a microservice can be implemented in multiple programming languages and frameworks, not all of them deliver out of the box prometheus readable metrics.
I will stick to the 3 most common used programming languages for microservice development:
Java/Spring Boot
Python
C#
Let’s start with the easiest one from effort perspective to provide prometheus ready metrics.
Spring Boot (Java) Microservice
Here are the good news: When you use the Microservice SDK you don’t have to do much, as everything that is needed is already there. Spring Actuator / Micrometer does the magic that happens here.
In detail this is:
A health endpoint
A prometheus metrics endpoint
Once you’ve developed your microservice and deployed to your cumulocity tenant you can already access the health & metrics endpoints with the following paths{yourC8YTenant}/service/{yourMicroserviceName}/health{yourC8YTenant}/service/{yourMicroserviceName}/prometheus
There is an example of a microservice providing standard jvm metrics but also custom metrics:
In my example I’m using this Java microservice which has been developed using the Microoservice SDK deployed in my tenant:
Health endpoint - {tenantURL}/service/mqtt-mapping-service/health
Metrics endpoint - {tenantURL}/service/mqtt-mapping-service/prometheus
The only thing we need in addition is a user to authenticate for these endpoints because all endpoints are secured within Cumulocity IoT.
Of course you can add custom metrics to your microservice. There is a comprehensive guide how you can do that.
Again, check out this example microservice to see how this can be done on example.
Python Microservice
For microservices implemented in python it is not as straightforward as with the Microservice SDK.
Still, you don’t have to go the whole “monitoring enablement way” totally alone. For python there is an open source prometheus client that easily enables prometheus ready metrics. The only thing we have to add are the system & adv. process metrics using psutil and exposing them to the prometheus endpoint.
Also I added a flask exporter that collects all HTTP request metrics and add it to the prometheus endpoint. This enables monitoring how much time some requests need.
To demonstrate a custom metric I added a counter which counts up constantly when the root endpoint is called simulating that a device is created via that endpoint.
This can help to get more business oriented metrics in prometheus to answer questions like “How many devices have been onboarded?”.
Here is an example hello-world microservice with basic system & process metrics:
#!flask/bin/python
import os
import time
from threading import Thread

import flask
import prometheus_client
import psutil
from flask import Flask
from prometheus_client import generate_latest
from prometheus_flask_exporter import PrometheusMetrics

app = Flask(__name__)
PrometheusMetrics(app)

UPDATE_PERIOD = 5
SYSTEM_USAGE = prometheus_client.Gauge('system_usage',
                                       'Hold current system resource usage',
                                       ['resource_type'])
PROCESS_USAGE = prometheus_client.Gauge('process_usage',
                                        'Hold current process resource usage',
                                        ['resource_type'])
DEVICE_COUNTER = prometheus_client.Counter('devices_created', 'Simulates a counter to count created devices')


# Hello world endpoint
@app.route('/')
def hello():
    DEVICE_COUNTER.inc()
    return 'Hello world!'

# Verify the status of the microservice
@app.route('/health')
def health():
    response = flask.Response('{ "status" : "UP" }')
    response.headers["Content-Type"] = "application/json"
    return response

@app.route('/prometheus')
def metrics():
    response = flask.Response(generate_latest())
    response.headers["Content-Type"] = "text/plain"
    return response

def system_metrics():
    process = psutil.Process(os.getpid())
    process.cpu_percent()
    while True:
        # print('Updating system metrics...')
        SYSTEM_USAGE.labels('cpu_usage').set(psutil.cpu_percent())
        SYSTEM_USAGE.labels('cpu_count').set(psutil.cpu_count())
        SYSTEM_USAGE.labels('memory_total').set(psutil.virtual_memory()[0])
        SYSTEM_USAGE.labels('memory_available').set(psutil.virtual_memory()[1])
        SYSTEM_USAGE.labels('memory_usage').set(psutil.virtual_memory()[2])
        SYSTEM_USAGE.labels('memory_used').set(psutil.virtual_memory()[3])
        SYSTEM_USAGE.labels('memory_free').set(psutil.virtual_memory()[4])
        PROCESS_USAGE.labels('cpu_usage').set(process.cpu_percent())
        if (hasattr(process, "cpu_num")):
            PROCESS_USAGE.labels('cpu_count').set(process.cpu_num())
        PROCESS_USAGE.labels('thread_count').set(len(process.threads()))
        PROCESS_USAGE.labels('memory_rss').set(process.memory_info().rss)
        PROCESS_USAGE.labels('memory_vms').set(process.memory_info().vms)
        PROCESS_USAGE.labels('memory_uss').set(process.memory_full_info().uss)
        if (hasattr(process, "pss")):
            PROCESS_USAGE.labels('memory_pss').set(process.memory_full_info().pss)
        if (hasattr(process, "swap")):
            PROCESS_USAGE.labels('memory_swap').set(process.memory_full_info().swap)
        time.sleep(UPDATE_PERIOD)

if __name__ == '__main__':
    daemon = Thread(target=system_metrics, daemon=True, name='Background')
    daemon.start()
    app.run(host='0.0.0.0', port=80)
If you want to know how to pack this python script and run it as a microservice please check out this guide: Examples - Cumulocity IoT Guides
The hello-world microservice is also deployed in my tenant and both required endpoints can be accessed using the following URLs:
Health endpoint - {tenantURL}/service/hello-world-metrics/health
Metrics endpoint - {tenantURL}/service/hello-world-metrics/prometheus
C# Microservice
For microservices implemented in C# it is actually very similar to python but using a different client of course:
When embedded in your c# microservice you can define own metrics or use built-in metrics.
Conclusion & Next Steps
In this part I showed you how to prepare any microservice to be integrated in an advanced monitoring using prometheus and grafana.
In the next part I will guide you through the setup of this open source tools on a VM.
Please continue your reading here:

Advanced Cumulocity IoT Microservice Monitoring - Part 2 Knowledge base
Overview In the first part of this series of article about Advanced Microservice Monitoring I explained what is needed to prepare your microservice so they can be integrated in a monitoring solution. In this second part I will guide you to setup a whole monitoring system on a separate Server / Virtual Machine (VM). Why do we need a separate server / VM you might ask? We want to have a reliable monitoring system which runs 24/7 and of course to detect when something is wrong with our service…

